Biological indicators are living systems. Their results carry real value — but interpreted in isolation, they can mislead. Here’s how FBIO should sit inside the broader validation framework.
The microbial-inactivation model
Sterilization processes are evaluated by their effect on microorganisms — typically measured as the reduction in viable colony-forming units (CFUs) that survive the process.
The established model assumes a log-linear relationship: the microbial population decreases by 1 log₁₀ unit (90%) for each defined exposure time at a specific temperature. This time period is the D-value, specific to both the microorganism and the temperature. Higher D-values mean greater resistance to thermal inactivation.
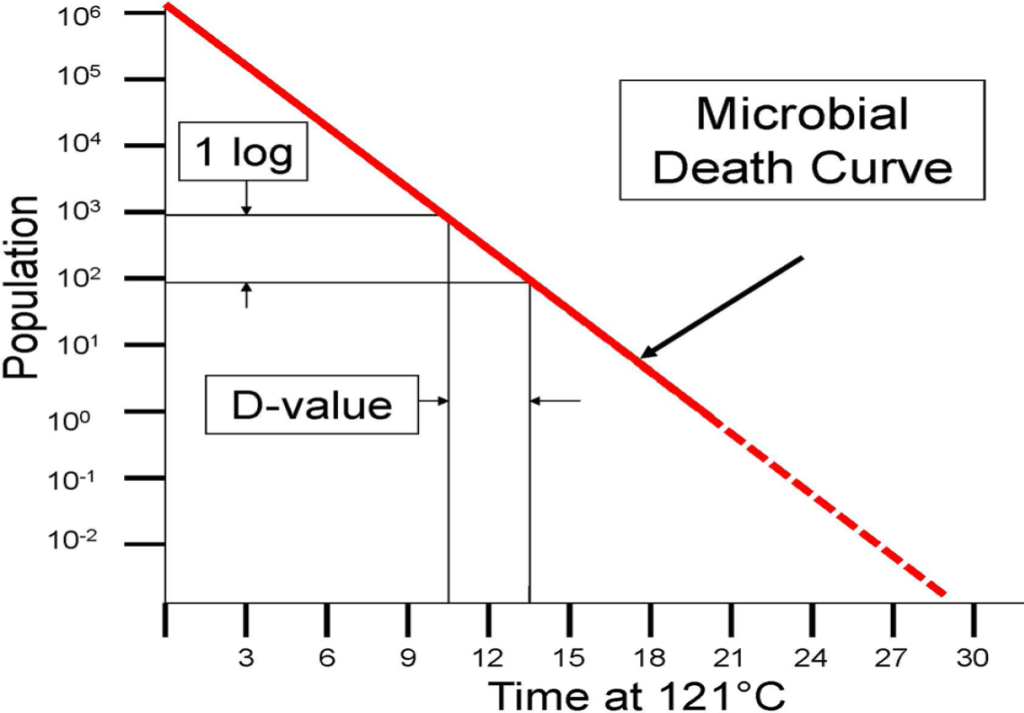
The mathematical expression for this first-order kinetic model is:

Where:
- N₀ = initial microorganism population
- N = microbial population after time t
- D = D-value at the specified temperature (a reference temperature of 121.1 °C is typically used)
Note: all logarithmic functions in this article refer to base-10 logarithms.
From log reduction to F-value
The effect on microorganisms is ultimately quantified as the overall process lethality, expressed by the F-value — the equivalent sterilization time, in minutes, at the reference temperature of 121.1 °C. In some cases the F-value is presented simply as a time value (process time at 121.1 °C) without explicitly referring to lethality, but by definition it always reflects the cumulative lethal effect.

F₀ from temperature: the physical lethality
Moist heat sterilization lethality can also be expressed from the temperature profile of the cycle. The change of D-value as a function of temperature is:

Where z (typically 10 °C) is the temperature change needed to alter the D-value by 1 log₁₀.
This enables calculation of overall lethality, F₀, from the actual temperature profile:

PDA Technical Report 1 ties the two together:
4.4.1.6 Evaluating FPHY and FBIO Agreement — For a sterilization cycle, when the FBIO of a BI is measurable, the FBIO and FPHY measured at the same location should be equal.
The overkill approach
The USP defines the overkill approach as: “the destruction of a high concentration of a resistant microorganism supports the destruction of reasonably anticipated bioburden that could be present during routine processing.”
This is commonly interpreted as:
- BIs containing a spore population of > 10⁶ represent the required “high concentration”
- Geobacillus stearothermophilus (ATCC 7953) is used as the BI organism, with typical D-values (DH) ranging from 1.5 to 2.5 minutes
The variability of BI resistance
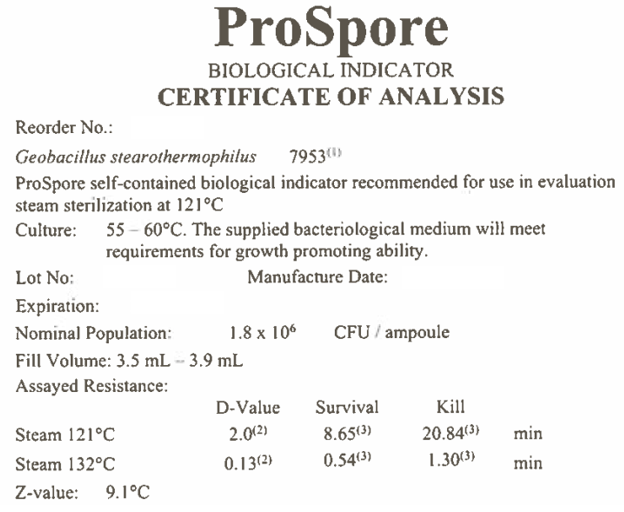
Biological indicators are living systems and therefore exhibit inherent variability in heat resistance. The declared D-value and spore population on a Certificate of Analysis (CoA) are averages based on multiple units. Using a single BI result to calculate the minimum cycle lethality (FBIO) may not always be scientifically justified.
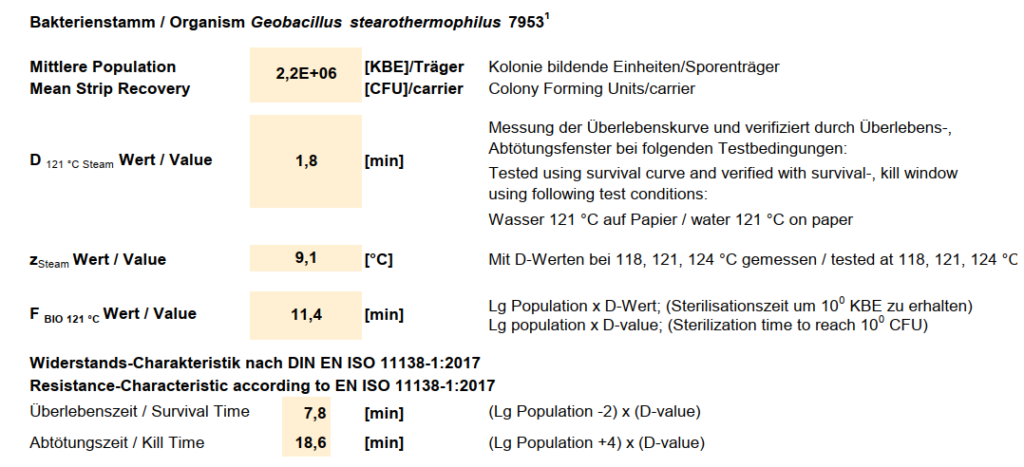
From a representative BI CoA:
- Nominal Population: 2.2 × 10⁶ spores per unit
- D-value: 1.8 minutes at 121 °C
Theoretical lethality required to achieve complete inactivation (assuming N = 1):

Survival Time (7.8 minutes)
The maximum lethality at which the BI must survive.
Kill Time (18.6 minutes)
The minimum lethality required to ensure complete inactivation of all BIs.
What these values actually mean
Survival time represents the upper boundary of lethality the BI is expected to survive. If a BI is killed, we know only that the lethality exceeded this value, not by how much.
Kill time represents the minimum lethality at which there is high confidence all BIs in the batch will be inactivated. The calculated cycle lethality (FPHY or F₀) should be higher than this to assure complete kill.
The range between survival time and kill time (7.8–18.6 minutes in this example) is essentially a zone of uncertainty. If a BI is inactivated during a cycle, it can only be concluded that the lethality was somewhere within this range — not necessarily equal to the calculated FBIO.
Calculated vs. empirical: a real example
The formulas for survival and kill times are intentionally conservative. In practice, the actual survival time is often longer than calculated, while the true kill time is often shorter than estimated. Adapted from Gillis (2005):
- Lot D-value: 2.0 minutes
- Population: 2.0 × 10⁵ spores/unit
- Calculated Survival Time: 6.6 minutes
- Calculated Kill Time: 18.6 minutes
| 121 °C Exposure (min) | Sterile Units / 20 | Annotation |
|---|---|---|
| 6.5 | 0 / 20 | Empirical Survival Time |
| 8 | 1 / 20 | |
| 9.5 | 7 / 20 | |
| 11 | 14 / 20 | |
| 12.5 | 16 / 20 | |
| 14 | 18 / 20 | |
| 15.5 | 20 / 20 | Empirical Kill Time |
| 17 | 20 / 20 |
- Actual survival time lies between 6.5 and 8.0 minutes — most probably ~8.0 minutes (only 1 sterile unit in 20 at 8 min)
- Actual kill time falls between 14.0 and 15.5 minutes — likely ~15 minutes based on complete inactivation observed at 15.5 min
The takeaway
Calculated survival and kill times offer a useful framework but tend to overestimate the actual lethality required. The biological variability intrinsic to BIs reinforces the need for caution when interpreting BI kill results as a direct measure of process lethality.
BIs provide valuable qualitative assurance — but their results should be considered within the full context of process validation, not used in isolation. In overkill cycles where physical lethality (F₀) sits comfortably above the kill time of the BI, the BI confirms the cycle worked. It does not, on its own, define how lethal the cycle was.
References
- Agalloco, J. — discussions on moist heat sterilization microbiology
- PDA Technical Report 1 — Validation of Moist Heat Sterilization Processes
- USP — General Chapter on Sterilization
- Gillis, J. R. (2005, September). What does the Survival/Kill Calculation on the Certificate of Analysis Really Indicate? Spore News, 2(3). Mesa Laboratories, Inc.